Financial markets, much like the seasons or the ocean tides, move in cycles. These recurring periods of expansion and contraction, of optimism and pessimism, are not anomalies to be feared but fundamental patterns to be understood. While no two cycles are identical in duration or magnitude, they are often driven by a predictable interplay of economics, institutional behavior, and, most critically, human psychology.
For the discerning “Prosumer” investor, developing a deep understanding of these rhythms is the cornerstone of long-term wealth creation. It provides a strategic map to navigate the market’s inevitable ebb and flow, helping you avoid the common behavioral pitfalls that erode returns and identify opportunities that others, caught in the emotional tide, may miss.
This guide provides a comprehensive framework for decoding these market cycles. We will move from foundational concepts and their underlying drivers to the powerful psychological forces that shape them. The goal is not to predict the market’s every move—a fool’s errand—but to equip you with the knowledge and discipline to act rationally and strategically, regardless of the market’s prevailing mood.
1. Market Cycles vs. Economic Cycles: Understanding the Crucial Lead-Lag Relationship
To begin navigating market cycles, one must first draw a clear distinction between a market cycle and an economic cycle. While intrinsically linked, they are not the same, and their asynchronous relationship is a primary source of confusion and poor timing for many investors.
- An economic cycle, often called a business cycle, refers to the natural fluctuation of the economy between periods of expansion (growth) and contraction (recession). It is measured by broad indicators of economic activity, most notably Gross Domestic Product (GDP), but also includes data on employment, industrial production, and corporate profits.
- A market cycle, in contrast, refers to the trends or patterns that emerge in financial markets. Its peaks and troughs are measured not by GDP, but by the price levels of assets, such as the S&P 500 index for the stock market.
The most critical concept for an investor to grasp is that the stock market is a leading indicator of the economy. Historically, stock market cycles have anticipated turns in the economic cycle by an average of 6 to 12 months. This means the market typically peaks and begins to decline before a recession officially starts, and it bottoms out and begins to recover before the economy shows clear signs of improvement.
The Forward-Looking Discounting Mechanism
This lead-lag relationship is not a coincidence; it is a fundamental feature of how markets function. Financial markets operate as a forward-looking discounting mechanism. Stock prices do not reflect the current state of the economy; they reflect the market’s collective expectation of future corporate profits. Since corporate profits are intrinsically linked to the future health of the economy, the stock market is essentially a massive, sentiment-driven bet on where the economy will be in the next two to four quarters.
This dynamic creates a structural timing trap for many individual investors. The general public often gains confidence and feels safest investing when economic news is positive and widely reported—strong GDP growth, low unemployment, and record corporate profits. However, these are all lagging economic indicators; they confirm a reality that has already passed. By the time this good news becomes common knowledge, the market, in its forward-looking capacity, may have already priced in this growth and could be approaching a peak.
Conversely, during the depths of a recession, when economic news is dire and sentiment is at its worst, the market may already be quietly beginning its next ascent, anticipating an eventual recovery. This timing mismatch explains a persistent and unfortunate pattern: many investors inadvertently buy high, fueled by the comfort of good economic news, and sell low, driven by the fear of bad economic news.
2. Defining the Market’s Movements: Bull, Bear, Secular, and Cyclical Trends
Market movements unfold across different timeframes and are described using specific terminology. A clear understanding of these definitions is essential for contextualizing market behavior.
Bull vs. Bear Markets
The most common terms are bull and bear markets, which describe the primary direction of the market.
- A bull market is a sustained period of rising prices, characterized by investor optimism and a generally robust economy. It is technically defined as a rise of 20% or more from a recent low.
- A bear market is the opposite: a prolonged period of declining prices, typically defined as a drop of 20% or more from a recent peak. It is associated with widespread pessimism and economic contraction.
Historical data reveals an important asymmetry: bull markets have historically been much larger and longer-lasting than periods of decline, rewarding investors who can remain disciplined through the downturns.
Secular vs. Cyclical Trends
Beyond the immediate bull and bear labels, trends can be classified as either secular or cyclical, a distinction crucial for long-term strategic planning.
- Secular trends are long-term, enduring market movements that can last for many years, sometimes even decades. They are driven by powerful, fundamental shifts in society, technology, or demographics. For example, the decades-long shift from traditional retail to e-commerce or the rise of artificial intelligence are secular trends. These forces create sustained tailwinds for specific industries, often independent of the shorter-term business cycle.
- Cyclical trends are shorter-term fluctuations that are closely tied to the economic or business cycle. Industries like housing, automobiles, and industrial commodities are highly cyclical because their performance is directly dependent on economic growth and consumer spending. These trends tend to repeat as the economy moves through its phases of expansion and contraction.
Distinguishing between these two types of trends allows investors to build portfolios that can both capitalize on short-term economic fluctuations and align with powerful, long-duration structural changes.
3. The Four Foundational Stages of a Market Cycle
While every cycle has unique characteristics, most can be understood through a four-stage framework popularized by analysts like Richard Wyckoff. This model—comprising accumulation, markup, distribution, and markdown—provides a clear roadmap for interpreting price action, volume, and investor sentiment, offering clues as to where the market is and where it might be headed next.
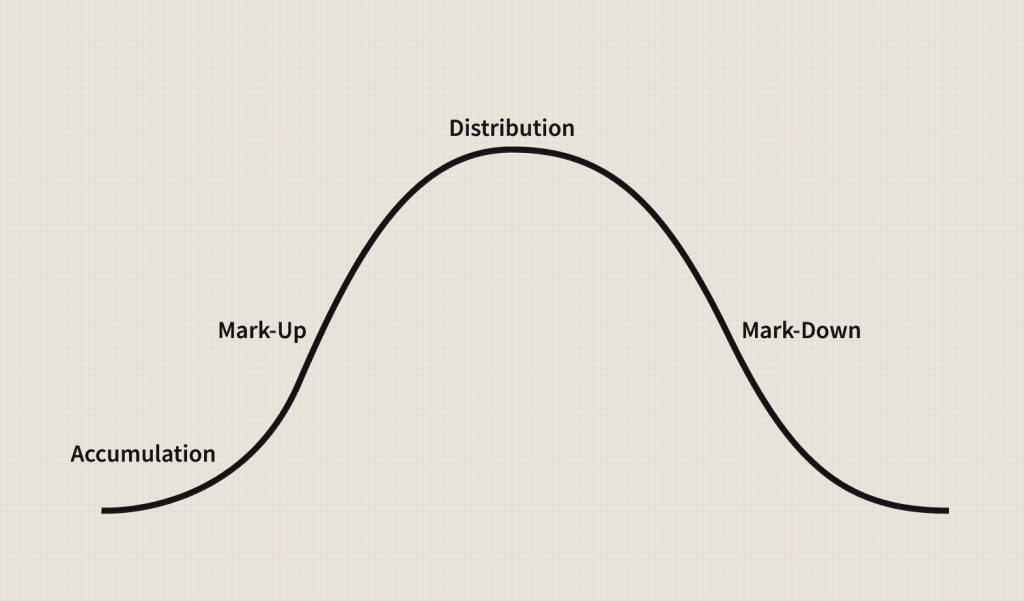
A chart illustrating the four stages of a market cycle: Accumulation (flat bottom), Markup (uptrend), Distribution (flat top), Markdown (downtrend).
Stage 1: Accumulation (The Bottom)
The accumulation phase marks the bottom of a market cycle. After a prolonged decline (the markdown phase), selling pressure subsides, and prices begin to stabilize, moving sideways within a defined trading range. This is the stage where institutional investors and other “smart money” operators begin to quietly acquire, or accumulate, large positions.
- Price Action: Sideways, range-bound price action. Bottoming patterns form.
- Volume: Volume may spike at selling climaxes but is generally subdued as the trend stabilizes.
- Investor Psychology: Anger, Depression, Disinterest. The news flow is typically negative, and few retail investors are interested in buying.
- Smart Money Action: Quietly buying large positions from the last of the capitulating sellers.
This is the phase where assets are most undervalued and where the seeds of the greatest long-term gains are sown.
Stage 2: Markup (The Bull Market)
The markup phase is the bull market, the period of a sustained uptrend. This stage begins when the price decisively breaks out of the accumulation range, often accompanied by a significant increase in trading volume. This breakout signals that buyers have finally overwhelmed sellers, attracting trend-followers and the broader investing public.
- Price Action: A clear and consistent uptrend with higher highs and higher lows.
- Volume: Volume increases on up-moves and contracts on pullbacks, confirming the trend’s strength.
- Investor Psychology: Moves from Disbelief (“This rally will fail”) to Hope, then to Optimism, and finally to firm Belief.
- Smart Money Action: Holding existing positions and potentially adding more on minor pullbacks.
This is the phase where most market participants make their money, and the trend often becomes its own catalyst, as rising prices attract more buyers, pushing prices even higher.
Stage 3: Distribution (The Top)
The distribution phase is the topping process of the market cycle. After a long and powerful markup, the “smart money” that bought during the accumulation phase begins to sell, or distribute, their holdings to the public. This selling is often masked by peak market euphoria.
- Price Action: Becomes choppy and directionless. The market struggles to make new highs, and rallies are met with significant selling pressure.
- Volume: Often remains high, but the price makes little upward progress (a phenomenon known as “churning”).
- Investor Psychology: Euphoria, Complacency, Greed. Late-arriving investors, driven by the fear of missing out (FOMO), eagerly buy into the market.
- Smart Money Action: Gradually and skillfully selling their positions to the exuberant public without causing a panic.
Stage 4: Markdown (The Bear Market)
The markdown phase is the bear market, a period of sustained decline. This stage begins when the price breaks below the support level of the distribution range, confirming that sellers have taken control. A clear downtrend of lower lows and lower highs emerges.
- Price Action: A consistent downtrend. Support levels are broken one after another.
- Volume: Volume may spike on down-moves, confirming the strength of the selling pressure.
- Investor Psychology: Moves from Anxiety and Denial to Panic and finally to Capitulation. Fear becomes the dominant emotion.
- Smart Money Action: Selling short or remaining in cash, waiting patiently for the next accumulation phase to begin.
This phase is painful but necessary; it serves to purge the market of the excess speculation, leverage, and weak hands that accumulated during the peak. The markdown continues until the selling is exhausted, prices find a bottom, and the cycle begins anew.
4. The Human Factor: Mastering the Psychology of the Cycle
If economics and earnings were the only drivers, market cycles would be far more subdued. The wild swings from boom to bust, the bubbles and the crashes, are fueled by the most powerful and unpredictable force of all: human emotion. The collective psychology of market participants—the oscillating waves of greed and fear—is what amplifies the underlying cycle, causing markets to overshoot fair value on the way up and undershoot it on the way down.
The 14 Phases of the Investor Emotion Cycle
This psychological journey is so predictable that it has been mapped into a model often called the “Cycle of Market Emotions.” It provides a narrative overlay to the four mechanical stages, explaining the why behind the what.
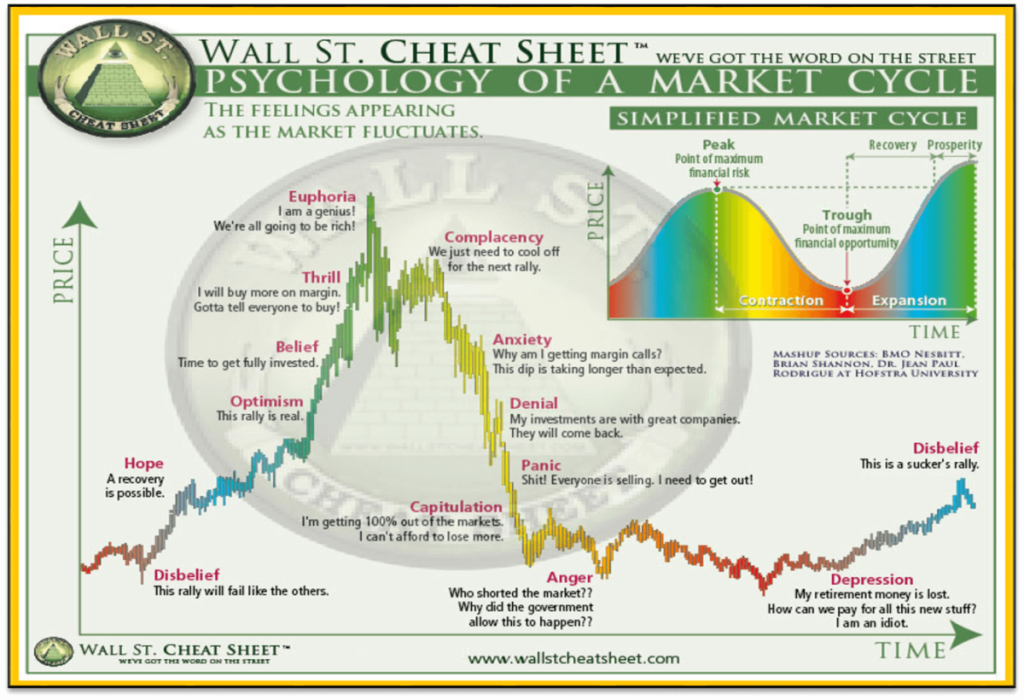
The “Wall Street Cheat Sheet: Psychology of a Market Cycle” chart, showing the emotional rollercoaster from Disbelief to Euphoria and back down to Depression.
- Disbelief: As the market rises from a deep low, most investors are skeptical, dismissing it as a “dead cat bounce.”
- Hope: As prices grind higher, a glimmer of hope emerges. “Maybe a recovery is possible.”
- Optimism: The rally gains momentum, and sentiment shifts. More participants enter the market.
- Belief: The uptrend is firmly established. Investors become confident and fully commit their capital.
- Thrill: The rally accelerates. Excitement takes over, and investors may begin to use leverage.
- Euphoria: The point of maximum financial risk. Prices become parabolic. Investors feel invincible. The “this time is different” narrative takes hold.
- Complacency: The market experiences its first sharp drop, but it’s dismissed as a healthy correction.
- Anxiety: The market fails to make a new high. The dip lasts longer than expected, and investors feel uneasy.
- Denial: As the downtrend takes hold, many cling to the belief that their “good quality” stocks will recover.
- Panic: The decline accelerates. Raw fear becomes the primary emotion. Investors sell indiscriminately to stop the pain.
- Capitulation: Investors give up completely, selling remaining holdings at any price, vowing never to invest again.
- Anger: After capitulating, investors look for someone to blame—the government, “the system.”
- Depression: The emotional low point. There is a pervasive sense of loss and hopelessness. This is the point of maximum financial opportunity.
- Return to Disbelief: The cycle begins anew.
This psychological cycle is a self-reinforcing feedback loop. The greed during the euphoria stage attracts the last buyers at the highest prices, providing the liquidity for smart money to sell. Conversely, the intense fear during the panic stage compels the weakest hands to sell at the lowest prices, allowing smart money to accumulate.
A Practical Toolkit for Overcoming Behavioral Biases
Recognizing these hardwired psychological biases in yourself is the first and most critical step toward making more rational investment decisions.
- Loss Aversion: The pain of a loss is felt about twice as strongly as the pleasure of an equivalent gain. This leads investors to hold on to losing stocks for too long and sell winning stocks too early.
- Antidote: Use a pre-determined stop-loss to automate the sell decision on losing trades.
- Herd Mentality: The instinct to follow the crowd. It causes investors to buy high during euphoric bubbles (FOMO) and sell low during panicked crashes.
- Antidote: Develop a written investment plan and stick to it. Base decisions on your own research, not on market noise.
- Overconfidence Bias: Overestimating your ability to predict the market. This leads to excessive trading and under-diversification.
- Antidote: Keep an investment journal to track the reasons for your decisions and their outcomes. This provides honest feedback on your actual performance.
- Confirmation Bias: The tendency to seek out information that confirms your pre-existing beliefs while ignoring evidence to the contrary.
- Antidote: Actively seek out and read well-reasoned arguments against your investment thesis. Play devil’s advocate with your own ideas.
- Recency Bias: Giving undue weight to recent events and extrapolating them indefinitely into the future.
- Antidote: Study market history. Understanding past cycles provides the crucial perspective that “this too shall pass.”
- Anchoring Bias: Relying too heavily on an initial piece of information, such as the purchase price of a stock.
- Antidote: Re-evaluate every position based on its current fundamentals and future prospects, not its cost basis. Ask yourself: “If I had cash today, would I buy this stock at its current price?”
5. The Futility of Prediction: The Evidence-Based Case Against Market Timing
Given the existence of cycles, the temptation to “time the market”—to sell at the top and buy back at the bottom—is immense. However, a vast body of evidence suggests that for the vast majority of investors, including professionals, attempting to consistently time the market is a losing strategy.
- You Must Be Right Twice: Successful market timing requires two correct decisions: when to sell and when to buy back in. Getting just one of these wrong can be devastating.
- The Best Days Drive Most of the Returns: A significant portion of the market’s long-term gains comes from a very small number of exceptionally strong days. Missing just a handful of these best days while sitting on the sidelines can severely damage long-term returns.
- Emotions Work Against You: Market timing forces you to act against your core emotions—to sell when everyone is euphoric and buy when everyone is panicked. Most investors do the opposite.
- Costs and Taxes: Frequent trading incurs higher transaction costs and can trigger significant tax liabilities, creating a high hurdle that market timers must overcome just to break even.
Studies consistently show that the average investor underperforms the market precisely because of poorly timed decisions. As the famous Morningstar “Mind the Gap” study regularly finds, the gap between fund returns and investor returns is almost entirely attributable to bad timing.
The conclusion is clear: for long-term success, time in the market is far more important than timing the market.
6. Start Your Cycle-Aware Investing Journey with Quantiverse.ai
Understanding market cycles is the first step. Applying that knowledge consistently is the key to unlocking superior returns. Quantiverse.ai is designed to be your Market GPS, providing the cyclical context you need to make smarter, data-driven decisions.
Our platform analyzes stocks through the lens of multiple, interconnected cycles—from the broad market and economic cycles discussed here to deeper capital, business, and valuation cycles. We cut through the noise and emotional bias to give you a clear, objective view of where a stock truly stands.
Ready to stop guessing and start seeing?
[Start Your Free Trial of Quantiverse.ai Today]
7. Frequently Asked Questions (FAQ)
Q1: How long does a typical market cycle last? A: There is no “typical” length. Historically, U.S. stock market cycles (from peak to peak or trough to trough) have ranged from a few years to over a decade. The focus should be on identifying the current stage of the cycle, not predicting its exact duration.
Q2: Is market cycle investing the same as market timing? A: No. Market timing is an attempt to make all-or-nothing bets on short-term market direction. Market cycle investing is a strategic approach that involves adjusting your portfolio’s asset allocation and sector exposure based on the prevailing, longer-term phase of the economic and market cycle. It’s about tilting the odds in your favor, not predicting the future.
Q3: Can I use market cycle analysis for individual stocks? A: Absolutely. While this guide focuses on the broad market, individual stocks and sectors have their own cycles. Understanding the broad market cycle provides the crucial context for analyzing a specific company. For instance, even a great company will struggle in a severe bear market (markdown phase). Quantiverse.ai specializes in applying this cyclical analysis at the individual stock level.
Q4: What is the single most important indicator for identifying the market cycle stage? A: There is no single magic indicator. A robust analysis requires a “confluence of evidence” approach, combining price action, volume, investor sentiment indicators (like the VIX Index), and leading economic indicators.